Agentic incident investigation with Claude Code
From now on, you'll be able to:
- have Claude Code investigate your active incidents automatically by querying your MCP tools in parallel,
- get structured findings posted to Tellagen with confidence scores and deep links,
- review, dismiss, or promote findings to your incident timeline, and
- connect any MCP tools you already use (Grafana, GitHub, PagerDuty, Sentry, Kubernetes, etc.).
What good does this do? The boring data-gathering part of an incident — checking logs, recent deploys, alert history — happens in parallel, without you opening six browser tabs. Results come back as structured findings with deep links, not a wall of text. You can verify anything with one click.
Here's how to try it yourself.
Getting started
Three steps. You'll be running your first AI investigation in under five minutes.
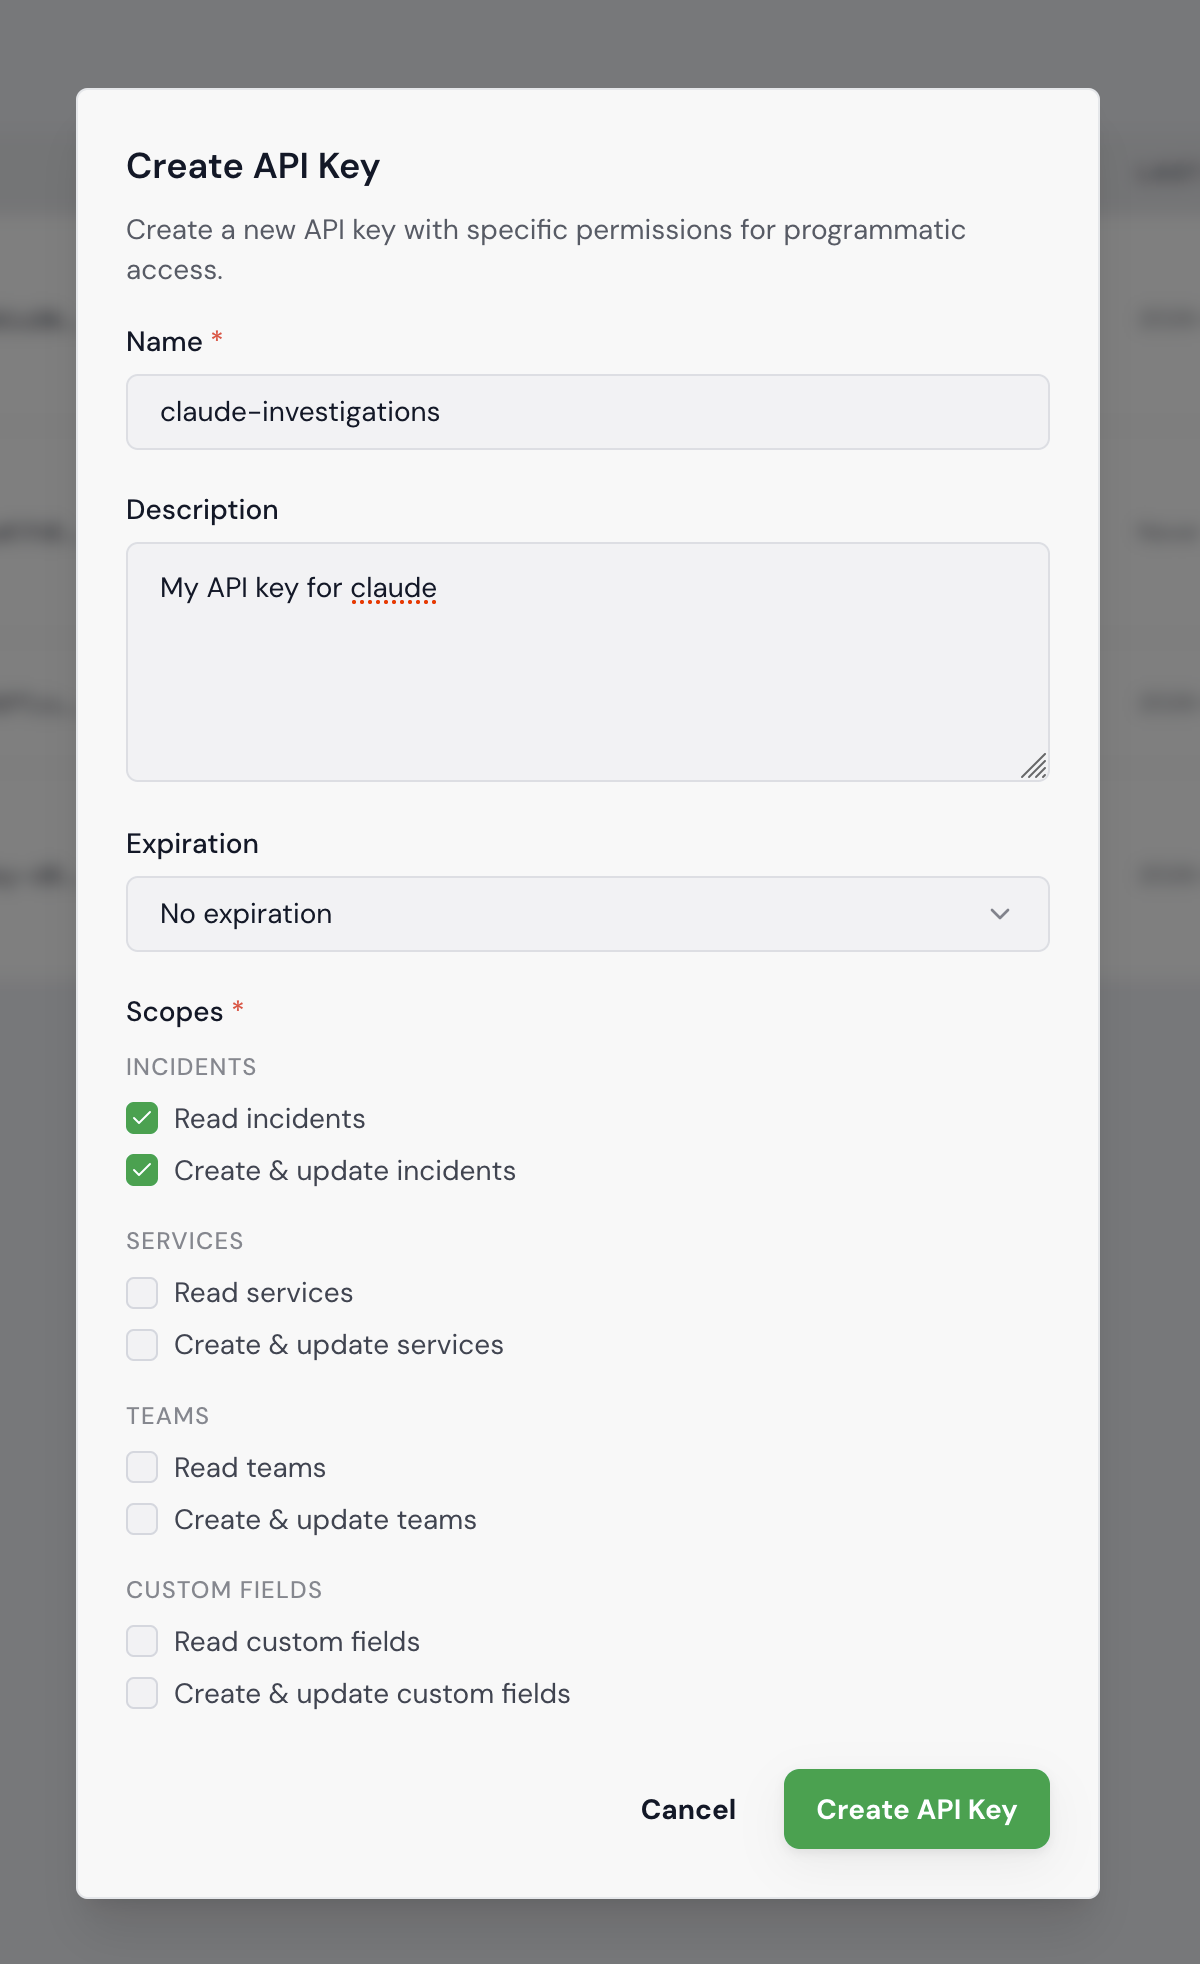
1. Create an API key. Go to Settings > API Keys in your Tellagen workspace. Click "Create API Key", give it a name like claude-investigations, and select at least the Incidents read and write scopes. Copy the key — it's only shown once.
2. Add the Tellagen MCP server to Claude Code.
claude mcp add tellagen \
  --transport stdio \
  --env TELLAGEN_API_KEY=tllg_xxx \
  --env TELLAGEN_API_URL=https://mycompany.api.tellagen.com \
  -- npx -y @tellagen/mcp-server
Replace tllg_xxx with your API key and mycompany with your workspace subdomain.
3. Run an investigation. Open Claude Code in your project directory and ask Claude to investigate:
Investigate incident #42 on Tellagen
Claude reads the incident context first — severity, affected services, what's already on the timeline — so it doesn't start from zero. Then it creates an investigation run, which shows up live in the Investigations tab. Your team can follow along as findings come in.
From there, Claude queries whatever MCP tools you have wired up — Loki logs in Grafana, recent commits in GitHub, alert history in PagerDuty, grepping through the codebase for the error message — all in parallel. As it finds things, it posts structured findings back to Tellagen: each with a type, confidence score, and links back to the source.
If you also have Grafana, GitHub, or PagerDuty MCP servers configured, Claude will use those too — no extra setup on the Tellagen side.
Want the full investigation skill? Install the Tellagen plugin to get a /tellagen skill that walks Claude through the complete investigation workflow step by step:
/plugin marketplace add tellagen/tellagen-marketplace
/plugin install tellagen
Then add your API key and URL to ~/.claude/settings.json:
{
  "env": {
    "TELLAGEN_API_KEY": "tllg_your_key_here",
    "TELLAGEN_API_URL": "https://mycompany.api.tellagen.com"
  }
}
If the file already has content, merge the env block into it. Then restart Claude Code for the env vars to take effect.
You can verify that the plugin works by running /plugin, going to installed plugins, and selecting tellagen.
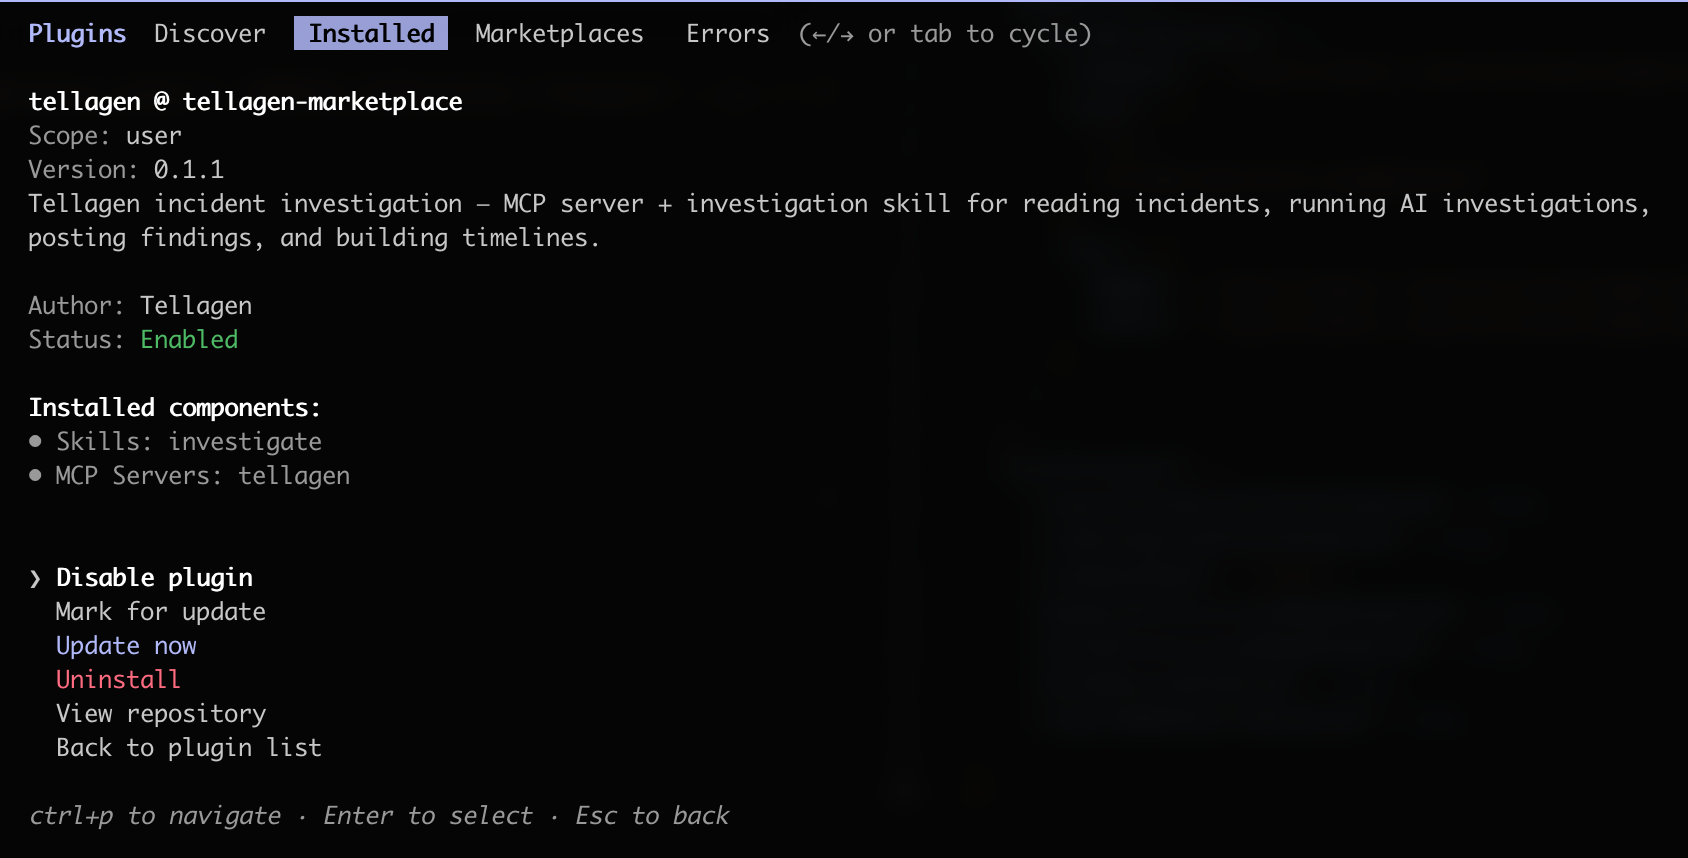
Then run the /tellagen command in any project to interact with the Tellagen API.
What a finding looks like
This is probably the most important design decision we made — findings are structured objects, not paragraphs of text. Each one has:
- a type that tells you what kind of insight it is,
- a one-sentence claim (the headline),
- an evidence summary with supporting data,
- a confidence score from 0 to 100%,
- evidence refs with deep links to Grafana, GitHub, PagerDuty, or wherever the data came from.
The types are worth explaining briefly:
- Observation — something notable ("Error rate is 5x normal")
- Correlation — two things that appear related ("Spike started 3 min after deploy X")
- Hypothesis — a proposed explanation ("Null check was removed in PR #456")
- Evidence — concrete proof ("Stack trace shows NPE at line 42")
- Recommendation — suggested action ("Roll back deployment abc123")
- Negative — something ruled out ("Database performance is normal")
The negative type is one I'm particularly happy about. During an incident, knowing what's NOT the cause saves real time. If the database is fine, you stop looking at the database.
Reviewing and promoting findings
Findings start as drafts. You go to the Investigations tab, and you'll see all the runs with their findings listed. For each one, you can do two things: dismiss it (if it's off-base), or promote it to the timeline.
When you promote a finding, it becomes a timeline event with all the evidence links attached. It's there when you write the postmortem. One click, and a finding goes from "AI thinks this might be relevant" to "this is part of the official incident record."
You can also click through to the evidence. Every finding links back to the Grafana explore URL, the GitHub commit, the PagerDuty alert — whatever the source was. So you never have to take the AI's word for it, you can verify in seconds.
A few patterns where this works well
I've been testing this against real incident scenarios. Let me show you a few.
Slow queries causing timeouts. Response times spike, nothing obvious changed. Claude checks Grafana for slow query logs, finds a query scanning millions of rows without an index, cross-references it against recent migrations in GitHub. It posts a finding with the query, the migration commit, and links to both. The on-call person doesn't need to manually dig through dashboards to connect those dots — the finding has both deep links right there.
Bad deploys. Error rate jumps. Claude checks what deployed recently, finds one that landed a few minutes before the spike, pulls the diff, and correlates the stack trace from logs with the actual code change. It posts findings in order: observation (error rate up), correlation (timing matches deploy), evidence (stack trace points to specific line). Sometimes the recommendation is just "roll back" — and that's fine, that's exactly what you need to hear at 2 AM.
Upstream issues. Latency creeps up, then requests start timing out. Claude checks upstream service response times, finds the payments provider started responding slower 20 minutes ago. It also posts a negative finding: "Database performance is normal." You stop looking at the database, you start looking at the provider's status page.
Connecting your tools
I should mention that Tellagen doesn't own your observability stack — Claude Code connects to whatever MCP servers you have. Grafana, Datadog, GitHub, PagerDuty, Sentry, Kubernetes — if there's an MCP server for it, Claude can use it during investigation. You add a new tool, and investigations automatically get richer. No configuration on the Tellagen side.
The investigation skill (/tellagen:investigate, available via the plugin) is a structured prompt that walks Claude through the workflow. You can customize it or write your own for specific failure patterns your team sees often. Let's say you deal with a lot of database issues — you could write a skill that always checks slow query logs and recent migrations first.
Your data never touches Tellagen
This is worth calling out explicitly, because it's the thing most teams ask about first.
When Claude investigates an incident, it queries your Grafana, your Loki, your GitHub, your PagerDuty — directly, through MCP connections that run on your machine. Tellagen never sees your logs, metrics, traces, or source code. We have no access to your observability stack, your repositories, or any other internal system.
What flows back to Tellagen are the structured findings — a one-sentence claim, a confidence score, and a summary the agent wrote. That's it. The raw log lines, the full stack traces, the actual metric data — all of that stays between Claude and your infrastructure.
The only Tellagen component in your setup is the MCP server, which is a thin API client that posts findings and reads incident metadata. It doesn't proxy your other tools, it doesn't phone home with telemetry, and it doesn't need network access to anything except the Tellagen API.
So you get automated investigation without granting us a single credential to your infrastructure. No Loki tokens, no Grafana service accounts, no GitHub PATs. The AI agent already has access to those tools through your existing MCP setup — Tellagen just gives it a structured place to put the results.
What's next
We'd like to get to a point where investigation starts automatically when an incident is created, so findings are already waiting when the on-call person opens the war room. We're also experimenting with letting investigations reference past incidents — if Claude saw a similar pattern before, it can start with hypotheses that worked last time.
All in all, this has been one of the most satisfying features to build. The investigation API, the structured findings, the promote flow — it all clicks together in a way that actually helps during an incident.
If you want to try it, sign up and connect your MCP tools. The investigation API is live today.
Next up, we're adding service runbooks so Claude has more context to work with, and automating more of the post-incident review. Stay tuned!

Written by
Andy Kohv
Comments
Loading comments...